
What matplotlib is
Matplotlib is a Python library used to create data visualizations, such as graphs, charts, histograms, and plots. It helps you present and understand data visually instead of looking only at numbers and tables.
You draw with pyplot. The short name is plt.
pandas holds the table. Matplotlib draws the picture.
Generating visualizations with pyplot is very quick:
import matplotlib.pyplot as plt

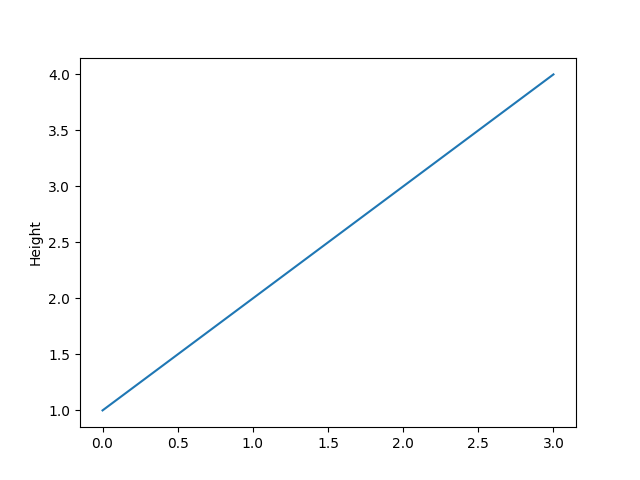
plt.plot([1, 2, 3, 4])
plt.ylabel('Height')
plt.show()
One list is the heights. The positions start at 0, so they are 0, 1, 2, and 3.
plt.ylabel('Height') names the y axis.
In order to save your progress and be able to pass to the next lesson you need to LOGIN
×