
Draw
Matplotlib draws pictures from lists.
You draw with pyplot. The short name is plt.
plt.show opens the picture.
A line follows the list from left to right.
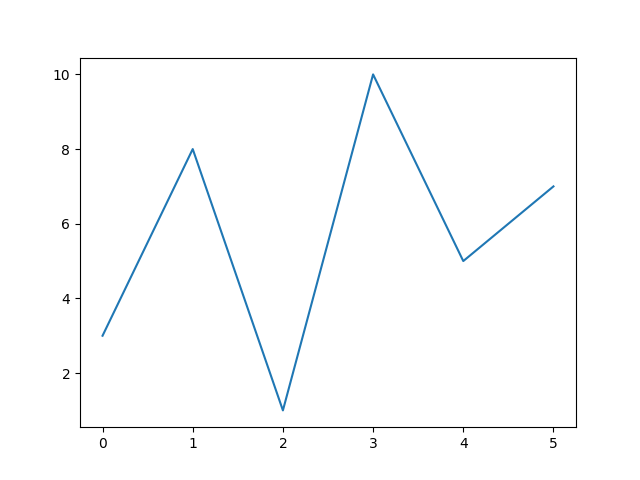
One list passed to plt.plot is the y coordinates.
The x coordinates start at 0.
import matplotlib.pyplot as plt

plt.plot([3, 8, 1, 10, 5, 7])
plt.show()
- The y coordinates are
3,8,1,10,5, and7. - The x coordinates are
0,1,2,3,4, and5. - The left end has x coordinate
0and y coordinate3.
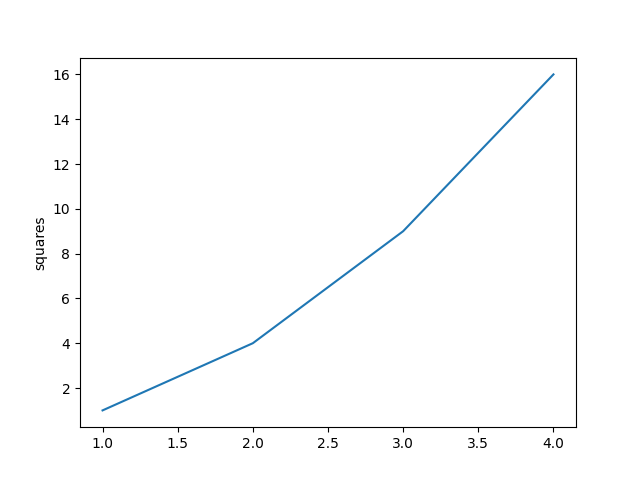
Two lists name both coordinates. The first list is the x coordinate of each point. The second list is the y coordinate.
import matplotlib.pyplot as plt

x = [1, 2, 3, 4]
y = [1, 4, 9, 16]
plt.plot(x, y)
plt.ylabel('squares')
plt.show()
- The x coordinates are
1,2,3, and4. - They do not start at
0, because the first list names them. - The squares are
1,4,9, and16. - The right end is
16. plt.ylabel('squares')names the y axis.
In order to save your progress and be able to pass to the next lesson you need to LOGIN
×